


Through recent case studies, we have had the opportunity to confront the world of satellite imagery. And we say world because of the immense amount of information that can be obtained from them and the potential for numerous treatments it offers. Of all that information, we specifically delve into Landsat satellite imagery.
State of existing vegetation at certain moments in time.
The study was born with the interest of knowing the state of existing vegetation in certain moments of time in a specific area, in order to serve as justification for the use of water for irrigation. The analysis of the terrain by means of orthophotos, current and historical, is something usual in our day to day. However, for queries on specific dates, even in ancient periods, the orthophotos known for consultation, such as the American Flights, Interministerial Flights and National Flights of the General Plan of Aerial Orthophotography (PNOA), may be insufficient, so we turn to Landsat images.
What are Landsat?
Landsats are satellites launched into orbit by the United States to observe the Earth’s surface. The first satellite, Landsat 1, was launched in July 1972, and since then, new launches have been made until today. Currently, the last satellite to be launched was Landsat 9 in September 2021, which is expected to release images in early 2022.
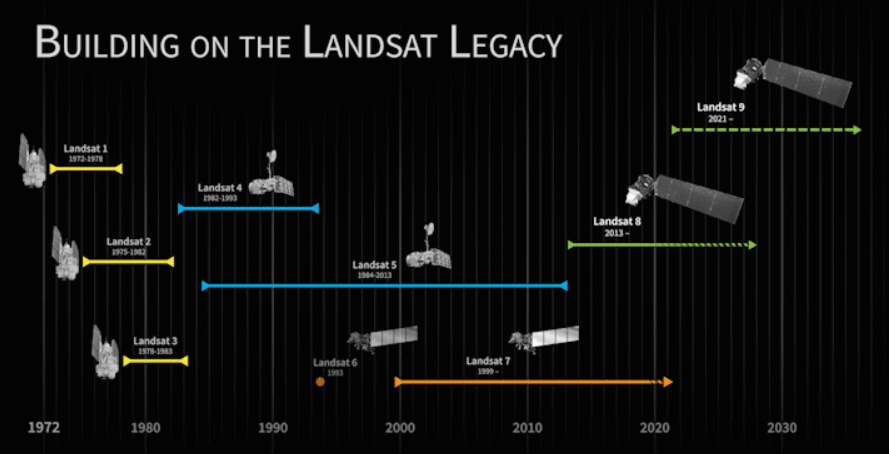
Chronology of the Landsat program
The information obtained from them is presented in the form of spectral bands at different frequencies. The number of bands and the frequencies they cover vary from satellite to satellite. In our case, we have obtained data from the Landsat Thematic Mapper (TM) sensor, which was carried on board Landsat 4 and 5, for the period of years covered, around 1990. It provides 6 spectral bands and 1 thermal infrared band. With this type of images, we lose precision and resolution, but we gain in variety of information.
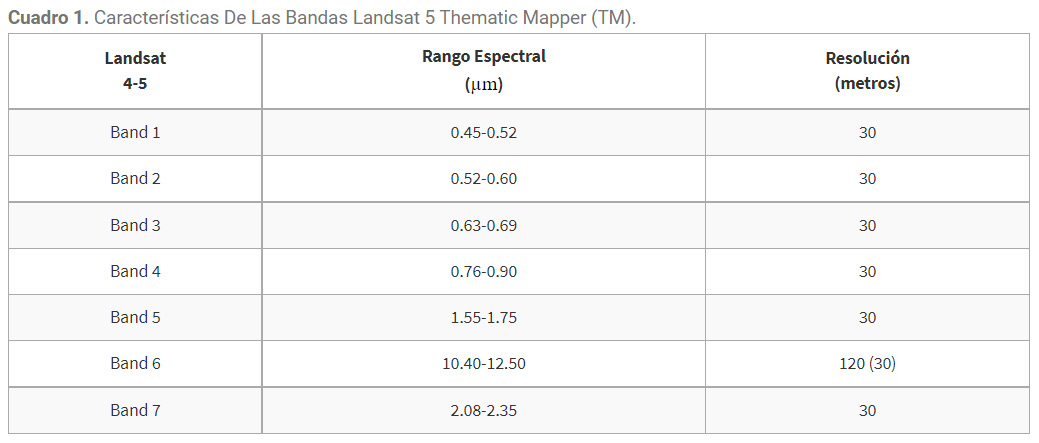
Characteristics of Landsat 5 Thematic Mapper (TM) bands.
From the different bands, performing combinations and operations with them, certain characteristics can be observed. Let’s take an example: R-G-B combination. This combination is obtained using bands 3, 2, and 1, for this particular satellite, and offers the closest image to the real colors. We can compare it with the orthophotos we normally handle.
Identifying which plots are under irrigation with Landsat
In our case, we have used the combination of the bands 4, 3, 2: NIR-R-G. The near infrared band (L5 Band 4) is useful to identify the boundaries between soil and water and is also sensitive to chlorophyll, thus allowing us to observe variations in vegetation, in shades of red. Water bodies are presented in shades of blue, from light to dark with increasing to decreasing suspended sediment load. Dense vegetation is presented in strong red, and darkens as the vegetation becomes sparser.
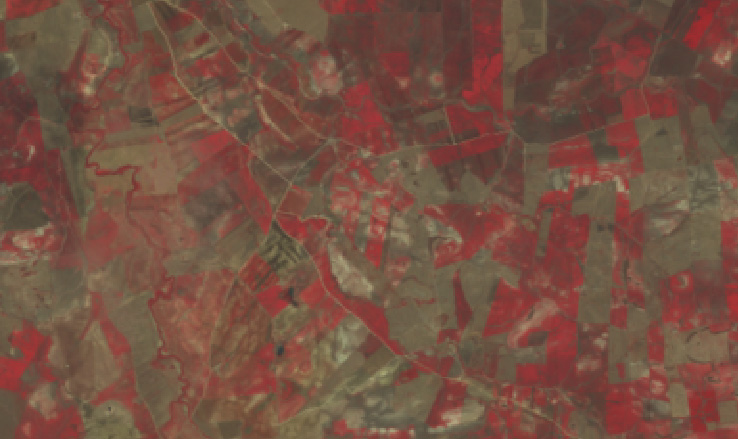
In this way, by consulting summer images we have been able to know which plot was irrigated and which was not, by simply observing the red of the vegetation detected by the satellite. By combining spectral bands, it is possible to extract terrain information such as soil moisture and vegetation, temperatures, urbanization and urban areas, textures and crops, etc.
These images are available for download through the USGS EarthExplorer viewer.
Written by:
Isabel Martín López
Civil Engineer.
Civil Engineering Area. Water Engineering Section


